October 27, 2022 . 1 MIN READ
You need the EC2 instance ID.
You can find it in the Amazon EC2 Console or by using the describe-instances command.
Basic monitoring is enabled by default, but detailed monitoring can also be enabled for more precise metrics.
Open the CloudWatch Console.
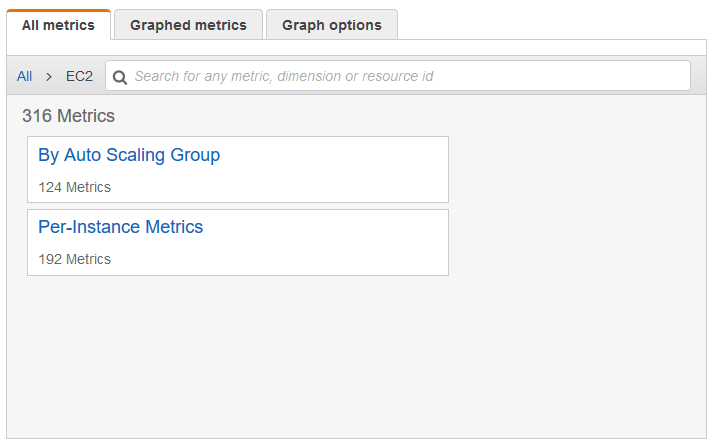
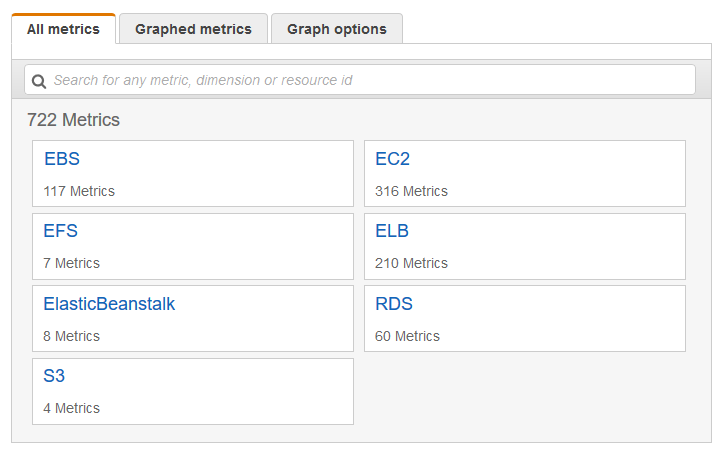
Go to Metrics → All Metrics.
Select the EC2 metric namespace.
Choose Per-Instance Metrics.
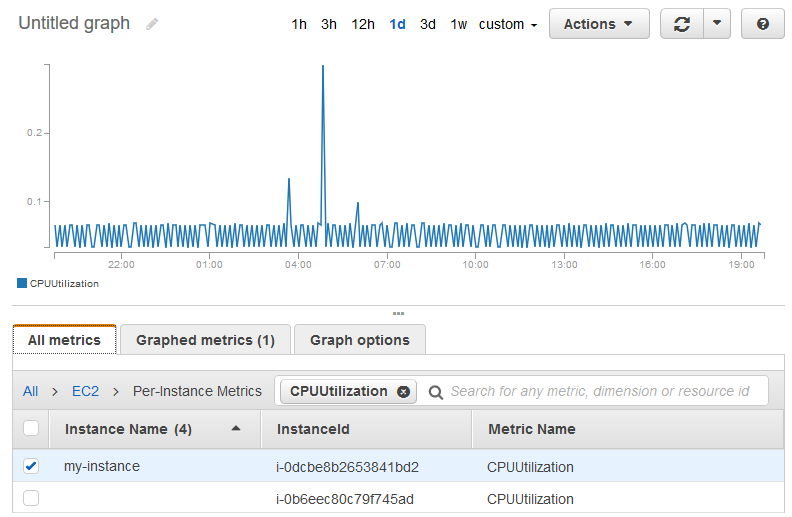
Search for CPUUtilization and select the row for your instance to view the graph.
You can customize the graph by:
Changing the time range.
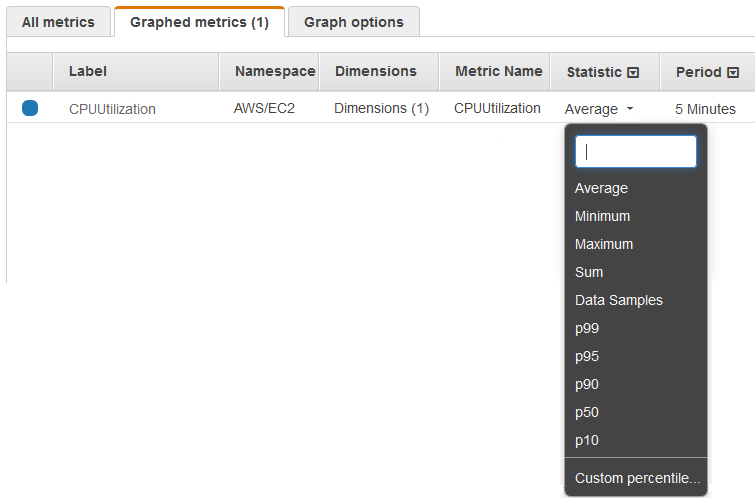
Selecting different statistics (average, max, percentiles).
Adjusting the data period.
You can retrieve CPU utilization data using the get-metric-statistics command for the specific EC2 instance.
The output provides CPU utilization metrics over a 24-hour period.
Data points represent the maximum CPU usage for each 6-minute interval.
The returned data points may not appear in chronological order.
✅ Very short summary:
To check EC2 CPU utilization, you can use Amazon CloudWatch via the console or the AWS CLI. The metrics show CPU usage over time, typically in 6-minute intervals, allowing you to analyze the instance’s maximum CPU utilization.
 aws cloudwatch get-metric-statistics –namespace AWS/EC2 –metric-name CPUUtilization \
–dimensions Name=InstanceId,Value=i-1234567890abcdef0 –statistics Maximum \
–start-time 2016-10-18T23:18:00 –end-time 2016-10-19T23:18:00 –period 360
{
“Datapoints”: [
{
“Timestamp”: “2016-10-19T00:18:00Z”,
“Maximum”: 0.33000000000000002,
“Unit”: “Percent”
},
{
“Timestamp”: “2016-10-19T03:18:00Z”,
“Maximum”: 99.670000000000002,
“Unit”: “Percent”
},
{
“Timestamp”: “2016-10-19T07:18:00Z”,
“Maximum”: 0.34000000000000002,
“Unit”: “Percent”
},
…
],
“Label”: “CPUUtilization”
}
Reference:
https://docs.aws.amazon.com/AmazonCloudWatch/latest/monitoring/US_SingleMetricPerInstance.html