November 2, 2022 . 3 MIN READ
AWS introduced Performance Insights alongside the release of Amazon Aurora with PostgreSQL compatibility. This feature helps users easily monitor and diagnose database performance issues through a visual dashboard that displays database load and identifies the SQL queries responsible for it.
Performance Insights collects performance data using lightweight methods, so it does not affect application performance. It requires no setup or maintenance, and the free tier includes 7 days of performance history and up to 1 million API requests per month. Users can extend the data retention period up to two years if needed. The feature is enabled by default for new database instances created through the AWS Management Console, and it can also be activated for existing instances through the console or API.
Performance Insights can be accessed in two ways from the Amazon RDS console:
Selecting Performance Insights from the navigation panel to view all instances with the feature enabled.
Clicking the Current Activity bar of a specific DB instance to open its detailed dashboard.
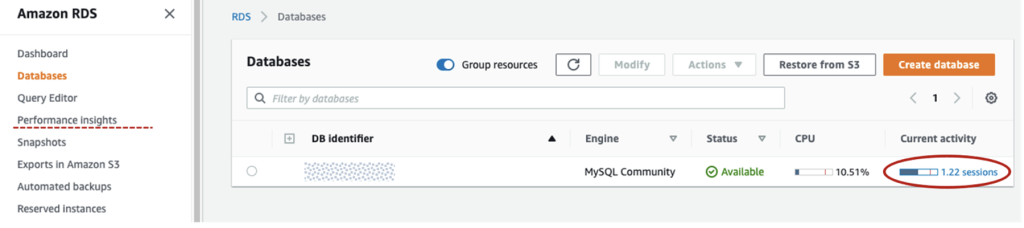
Performance Insights measures database load using Average Active Sessions (AAS). An active session represents a database connection that has sent a request but has not yet received a response. Monitoring the number of active sessions over time provides a clear picture of database workload.
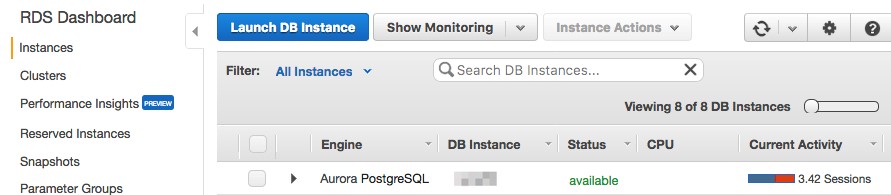
In the instance list, the Current Activity bar visually represents database load.
![]()
A blue bar indicates active load within capacity.
A red section means the database is exceeding host capacity and may require investigation.
The dashboard contains two main sections:
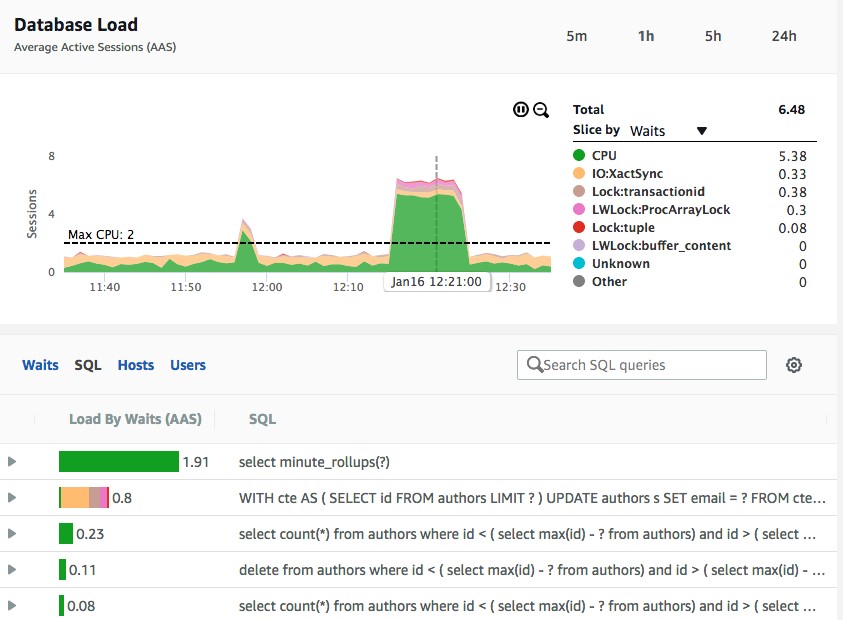
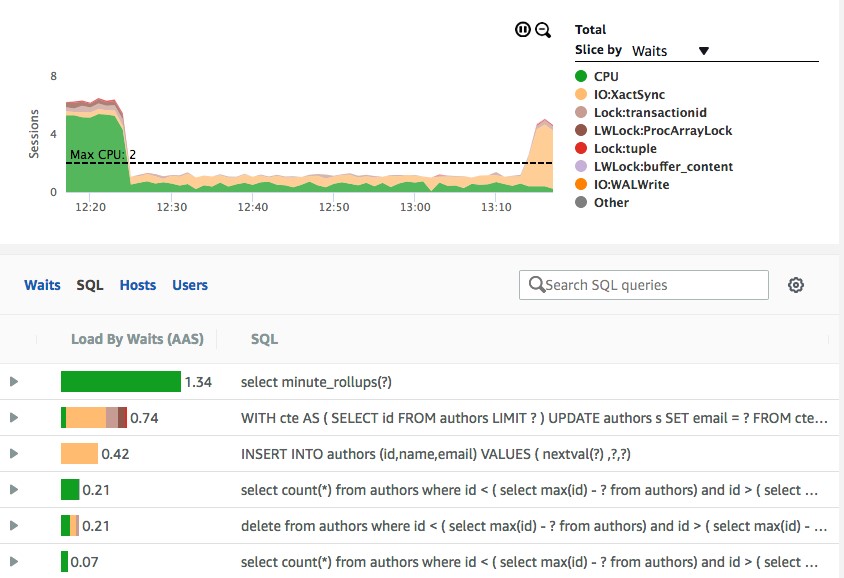
Load Chart: Displays recent database load history measured in AAS.
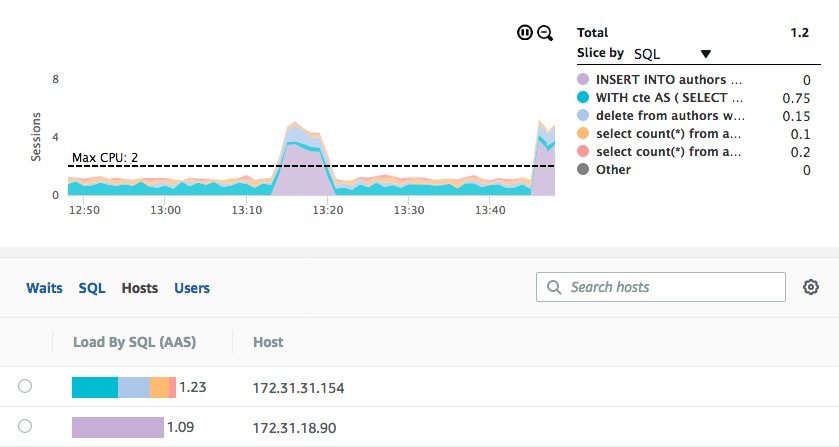
Top Activity Table: Shows which SQL queries or activities contribute the most to database load.
The load chart is color-coded by wait type, helping users understand whether the load is caused by CPU usage, I/O waits, locks, or other factors.
Performance Insights helps detect bottlenecks such as:
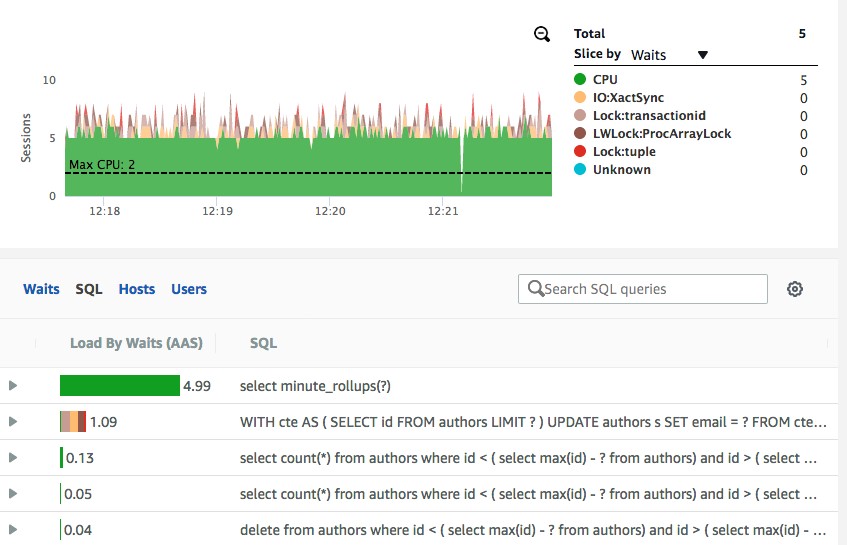
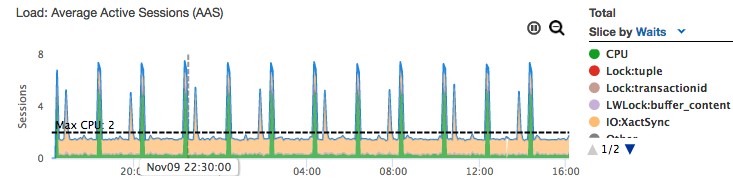
CPU Bottlenecks: Occur when active sessions exceed the available vCPU capacity. Solutions include scaling the instance size or optimizing resource-heavy queries.
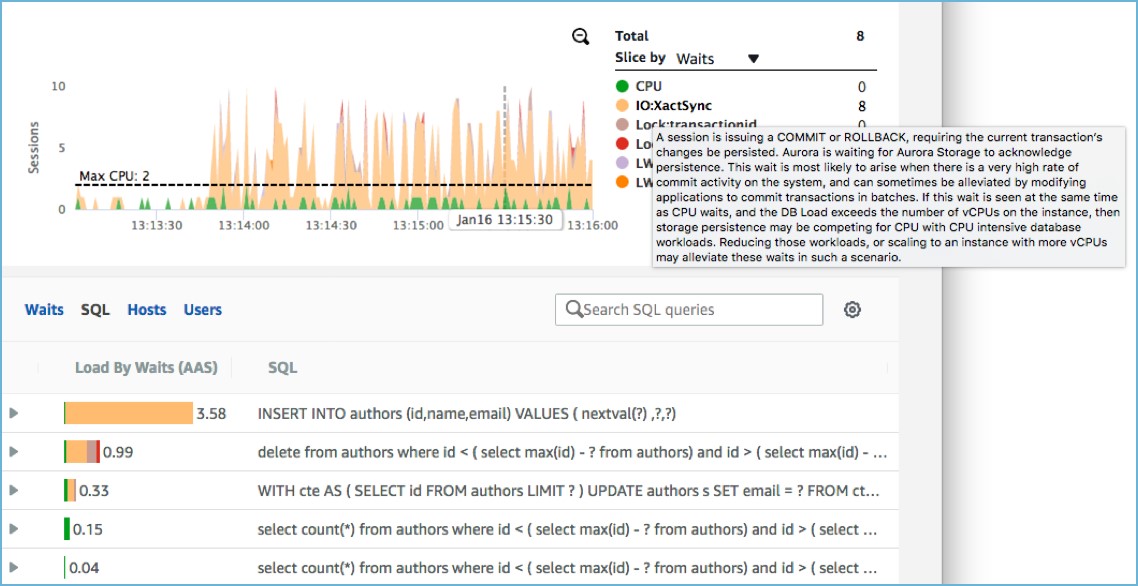
Wait Bottlenecks: These occur when sessions wait for resources such as disk writes or locks. For example, frequent single-row inserts may cause storage write delays, which can sometimes be optimized using batch inserts or disabling auto-commit.
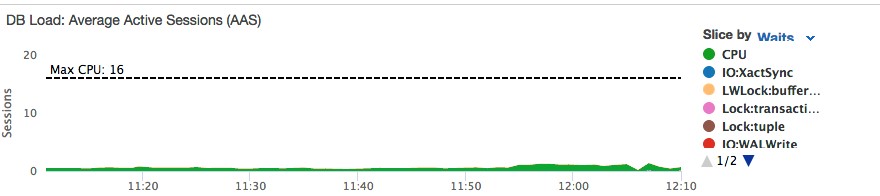
The tool can also assist in choosing the correct instance size:
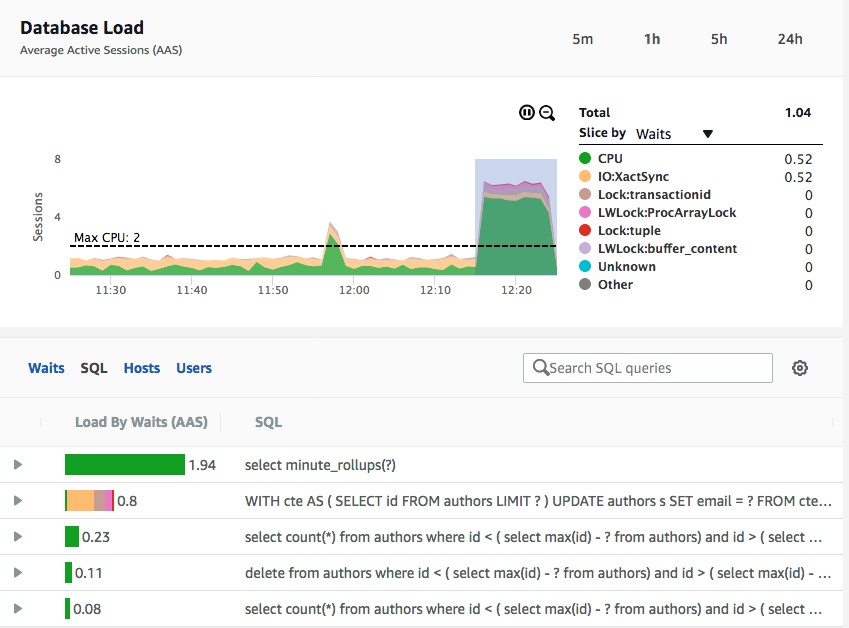
If load remains well below the maximum CPU line, the instance may be oversized and could be scaled down.
If load frequently exceeds CPU capacity, the instance may need to be scaled up or the workload optimized.
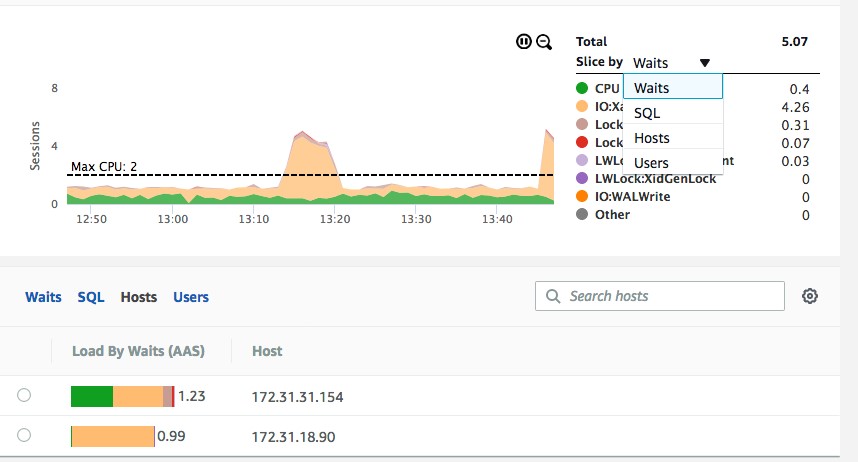
Performance Insights allows users to analyze database load across different dimensions, including:
SQL queries
Wait events
Client hosts
Database users
This helps identify uneven workload distribution, such as one application server generating significantly more database load than others.
Performance Insights provides an easy and effective way to monitor database performance in Amazon RDS. It highlights bottlenecks, identifies problematic queries, and helps determine appropriate database sizing. The service is fully managed, requires minimal overhead (around 1% of a vCPU), and supports several database engines including Aurora, PostgreSQL, MySQL, MariaDB, SQL Server, and Oracle.
Reference:
https://aws.amazon.com/blogs/database/analyzing-amazon-rds-database-workload-with-performance-insights/