Know how much an individual process or system-wide consume CPU or memory.

As a sysadmin, you often have to deal with an incident where the application is slow or unresponsive due to high CPU/memory/network utilization. If the server host just one process, then it’s easy to find out when the process consumes all the resources. However, imagine a shared server where multiple services are running, and you need to find which one is eating all the resources.

There are many monitoring software which does this out of the box. But if you don’t have one or looking for a command-based solution, then here you go. They are all FREE!
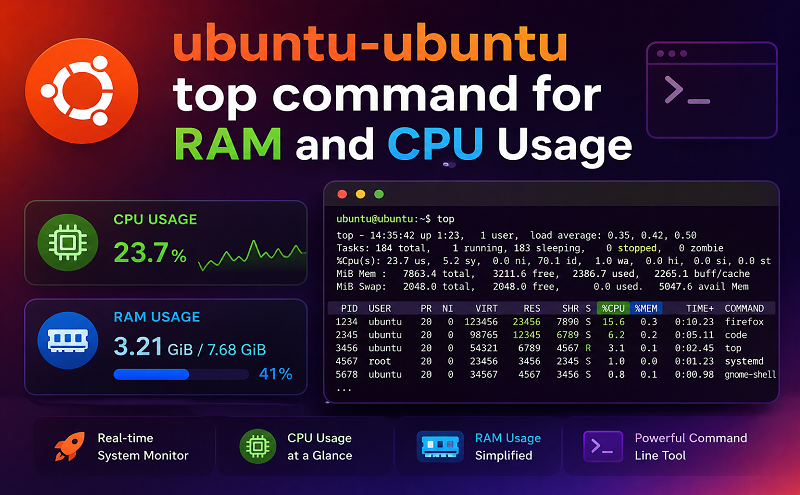
top

You may want to start by looking into top or htop result to see the processes overview.

As you can see below, it gives an excellent idea about what all processes are utilizing. If you look at the first one, which is MySQL is taking 11.9% of CPU and 2.5% of CPU.

top - 11:57:33 up 0 min,  1 user,  load average: 3.69, 0.96, 0.32
Tasks: 165 total,   2 running, 113 sleeping,   0 stopped,   0 zombie
%Cpu(s): 21.0 us,  5.5 sy,  0.0 ni, 70.5 id,  1.7 wa,  0.0 hi,  1.3 si,  0.0 st
KiB Mem :  7637308 total,  5802888 free,   849512 used,   984908 buff/cache
KiB Swap:        0 total,        0 free,        0 used.  6495648 avail Mem 

  PID USER      PR  NI    VIRT    RES    SHR S  %CPU %MEM     TIME+ COMMAND                                                                                                        
 1986 netdata   20   0 1738856 191560  22948 S  11.6  2.5   0:02.30 mysqld                                                                                                         
 3021 www-data  20   0  255288  78420  55484 S   6.6  1.0   0:01.55 php-fpm                                                                                                        
 3138 www-data  20   0  253096  79780  59228 S   6.6  1.0   0:00.92 php-fpm                                                                                                        
 3153 www-data  20   0  255116  79088  56472 S   5.0  1.0   0:00.70 php-fpm                                                                                                        
 3037 www-data  20   0  257200  81088  56216 S   4.3  1.1   0:01.50 php-fpm                                                                                                        
 3048 www-data  20   0  257088  78740  55380 S   4.3  1.0   0:01.46 php-fpm                                                                                                        
 3054 www-data  20   0  254160  72168  52108 S   3.7  0.9   0:01.32 php-fpm                                                                                                        
 3135 www-data  20   0  255084  75912  54836 S   3.7  1.0   0:00.91 php-fpm                                                                                                        
 3051 www-data  20   0  254096  73804  51964 S   3.0  1.0   0:01.38 php-fpm                                                                                                        
 2962 www-data  20   0   45280   7284   3488 R   2.0  0.1   0:00.22 openresty                                                                                                      
 1062 netdata   20   0  338748  76144   6720 S   1.0  1.0   0:01.31 netdata                                                                                                        
 1702 netdata   20   0   21852   4232   2352 S   1.0  0.1   0:00.34 apps.plugin                                                                                                    
 1729 netdata   20   0   18636   3280   2764 S   0.7  0.0   0:00.05 bash                                                                                                           
 1980 netdata   20   0   62008  12896   5796 S   0.7  0.2   0:00.14 redis-server                                                                                                   
   11 root      20   0       0      0      0 I   0.3  0.0   0:00.14 rcu_sched                                                                                                      
 1007 root      20   0 1347424  74524  38872 S   0.3  1.0   0:00.92 dockerd                                                                                                        
 1857 root      20   0   10600   5564   4276 S   0.3  0.1   0:00.03 containerd-shim                                                                                                
 2045 root      20   0    9948   6028   5016 S   0.3  0.1   0:00.14 forego                                                                                                         
 2934 root      20   0   13616   8760   5928 S   0.3  0.1   0:00.07 docker-gen                                                                                                     
 2966 systemd+  20   0   25784   7924   2340 S   0.3  0.1   0:00.06 nginx

The top is installed on almost all Linux distribution.

Once you identify the suspect, then you may want to focus on that process instead of everything like you saw above. You can still use top command but with some argument.

Let’s say you know the process id (PID); you can use the below command.

top -p $PID

Below an example of top -p 3102

top - 11:59:56 up 3 min,  1 user,  load average: 0.72, 0.70, 0.31
Tasks:   1 total,   0 running,   1 sleeping,   0 stopped,   0 zombie
%Cpu(s):  7.1 us,  2.9 sy,  0.0 ni, 89.1 id,  0.3 wa,  0.0 hi,  0.7 si,  0.0 st
KiB Mem :  7637308 total,  5802024 free,   783672 used,  1051612 buff/cache
KiB Swap:        0 total,        0 free,        0 used.  6555636 avail Mem 

  PID USER      PR  NI    VIRT    RES    SHR S  %CPU %MEM     TIME+ COMMAND                                                                                                        
 3102 www-data  20   0  329500  82376  60640 S   0.0  1.1   0:03.35 php-fpm

You may also use grep with top. Below an example of checking Docker utilization.

root@geekflare-com:~# top | grep docker
 1007 root      20   0 1347424  74524  38872 S   0.3  1.0   0:01.38 dockerd                                                                                                        
 2934 root      20   0   14676   9652   5928 S   0.3  0.1   0:00.54 docker-gen                                                                                                     
 1007 root      20   0 1347424  74524  38872 S   0.3  1.0   0:01.39 dockerd                                                                                                        
 1007 root      20   0 1347424  74524  38872 S   1.0  1.0   0:01.42 dockerd                                                                                                        
 2934 root      20   0   14740   9652   5928 S   0.3  0.1   0:00.55 docker-gen                                                                                                     
 2934 root      20   0   14740   9652   5928 S   0.3  0.1   0:00.56 docker-gen

htop

Similar to the top but with more information. As you can, it got the command column, which is handy to identify the process path. And also it is colorful.

htop-output

htop may not be installed by default, but you can always do it as below.

Install htop on Ubuntu

apt-get install htop

Install htop on CentOS/RHEL 8.x

dnf install https://dl.fedoraproject.org/pub/epel/epel-release-latest-8.noarch.rpm
dnf update
dnf install hto