November 3, 2022 . 3 MIN READ
Sometimes a database can become slow, which directly impacts the performance of your application. To address this issue, it’s important to monitor your database effectively and apply performance optimization techniques. Below is a quick guide outlining several steps that can help improve database performance and monitoring.
One of the first strategies is to create a read replica. A read replica reduces the workload on your primary production database by handling read-heavy operations such as data queries and reports. This allows the main production database to focus primarily on CRUD operations (Create, Read, Update, Delete).
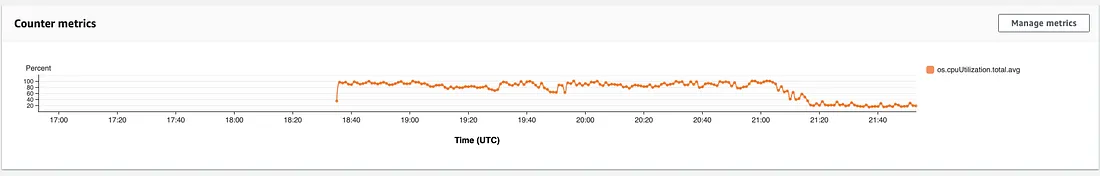
By implementing the following steps, we were able to reduce our database CPU usage from around 60% to below 15%.
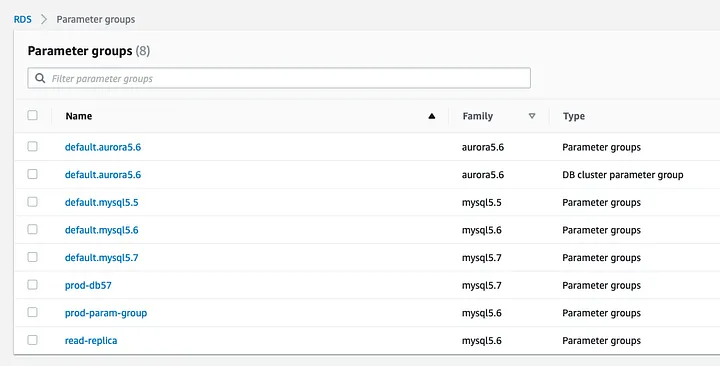
Start by navigating to the Amazon RDS Console in AWS. In the left navigation panel, select Parameter Groups. Here, you can create a new parameter group based on the default parameter group used when your database instance was created.
Note: You cannot modify the default parameter group that is currently attached to your database instance. Instead, create a new one and attach it to the database.
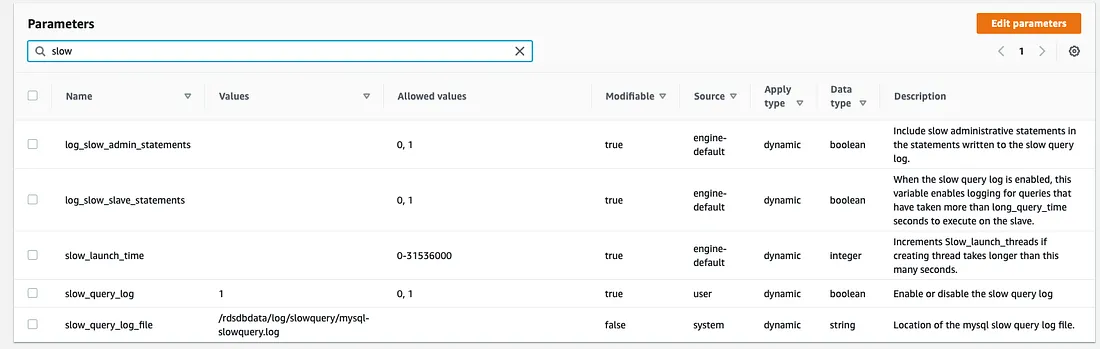
Within the parameter group settings, enable logging options that help identify performance issues. One important parameter to activate is slow_query_log. Setting this value to 1 enables logging for slow queries, allowing you to identify queries that take longer than expected to execute.
You can also configure where and how these logs are stored for better analysis.
The next step is to enable Performance Insights. You can do this by selecting your database instance in the RDS console and choosing the Modify option.
Performance Insights helps you identify which queries, operations, hosts, or users are placing the most load on your database. It provides detailed metrics such as CPU usage, wait events, and query execution time.
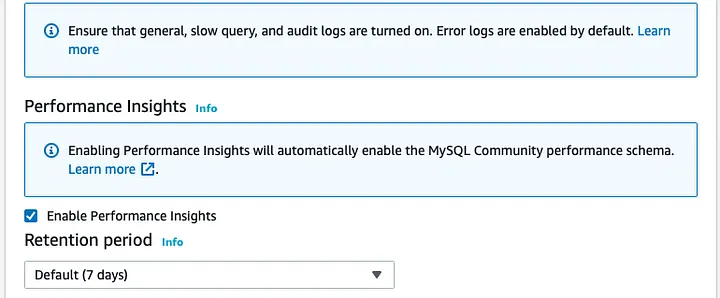
You can also configure the data retention period for performance monitoring.
Note: Whenever you modify settings such as the parameter group or Performance Insights, AWS allows you to apply the changes immediately (if possible) or during the next maintenance window.
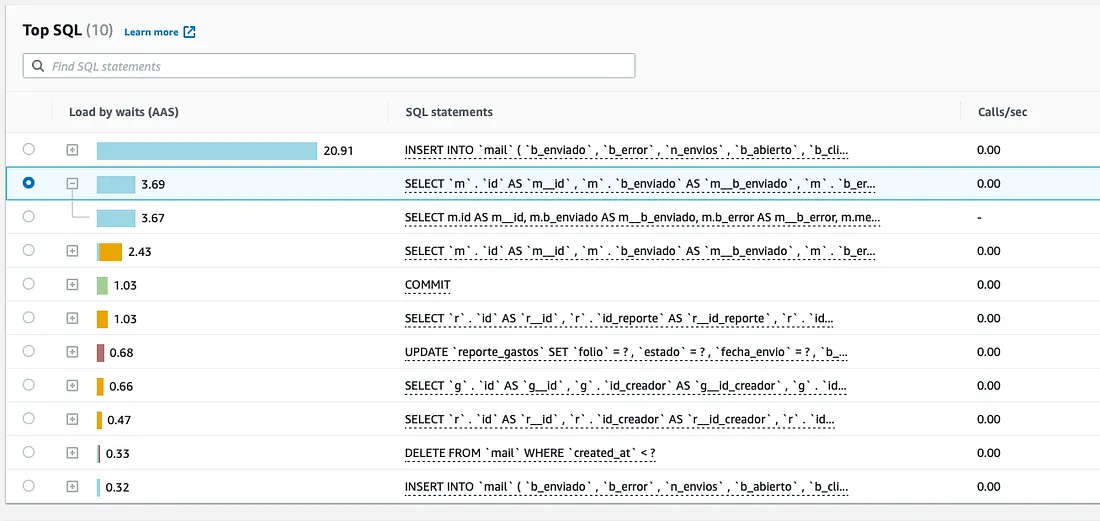
Once Performance Insights is enabled, analyze the queries that generate the highest Average Active Sessions (AAS).
AAS is a key metric used to measure database load. It indicates how many sessions are actively waiting for resources such as CPU, I/O, or locks. By identifying queries with high AAS values, you can determine which operations are causing performance bottlenecks.
This analysis can help guide important decisions about how your application processes and retrieves data.
Another important step is identifying queries that lack proper indexing. Queries that search large datasets without indexes can significantly slow down database performance.
By creating indexes on frequently queried columns, the database can retrieve data more efficiently. This improvement often leads to faster query execution and lower CPU usage.
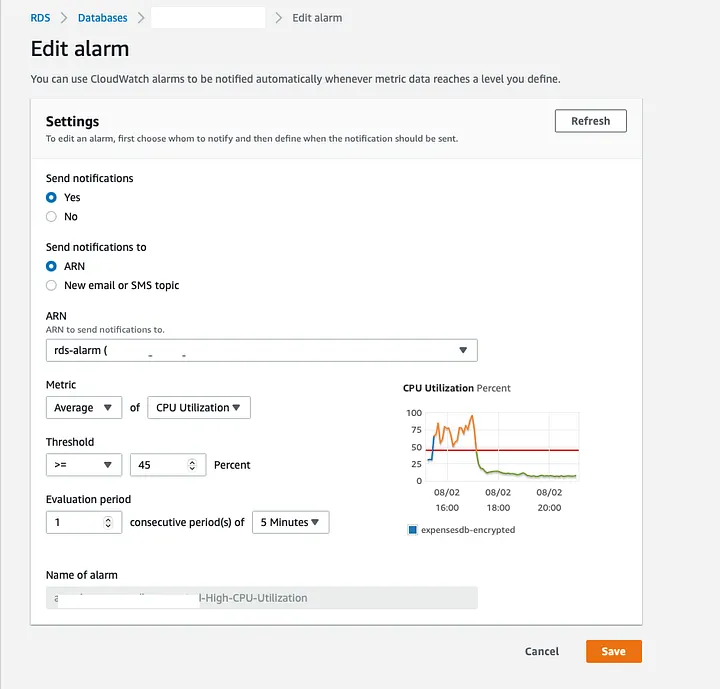
It is important to monitor critical metrics such as CPU utilization. You can configure Amazon CloudWatch alarms to notify you when CPU usage exceeds a defined threshold.
These alerts help you detect unusual activity or heavy workloads that may affect database performance. Monitoring trends also helps identify specific times or queries that cause performance spikes.
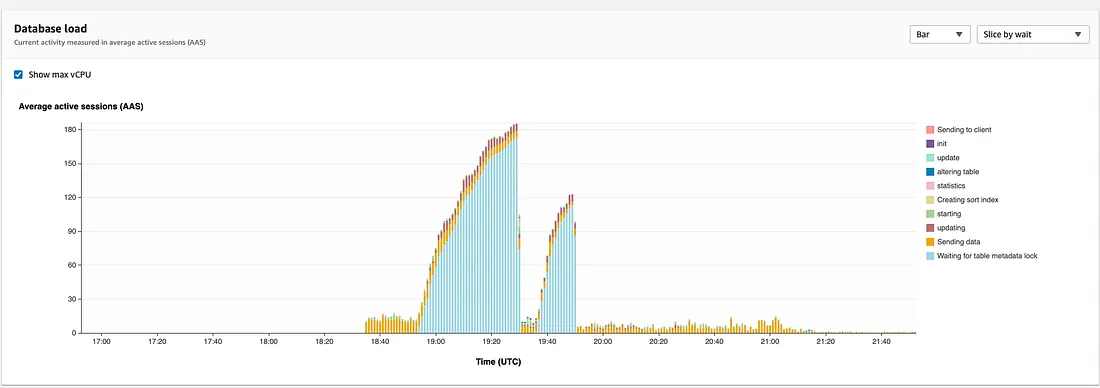
After applying these optimizations, we observed a significant improvement in database performance. The average CPU usage dropped from approximately 60% to under 15%, resulting in better application responsiveness.
Some temporary CPU spikes appeared during index creation. This occurs because the database temporarily locks metadata to maintain data integrity while building the index, especially when other sessions are accessing the same tables.
Overall, these optimizations greatly improved the stability and efficiency of our database environment.
Reference:
https://cavillarroel11.medium.com/improve-your-aws-rds-mysql-database-c1c70ca9f121